


Director, Strategic Insights
As this new chart makes clear, retail’s initially strong move to online sales—revealed in the Q2 2020 retail industry statistics we shared in August; see the full blog, below—was just the beginning. Want to transform your customers’ shopping experience while boosting revenue and building loyalty? Visit our Retail Industry web page.
What happens to retailers and shoppers when, virtually overnight, storefronts close, customer service reps are sent home, and consumers (many with extra spare time and a newfound focus on bargain hunting) stampede their favorite brands’ digital channels?
The answer, for retailers using a robust chat and messaging solution, is: “We got this!” For these retailers’ customers, many of them new to online support and service, the answer is: “This works!”
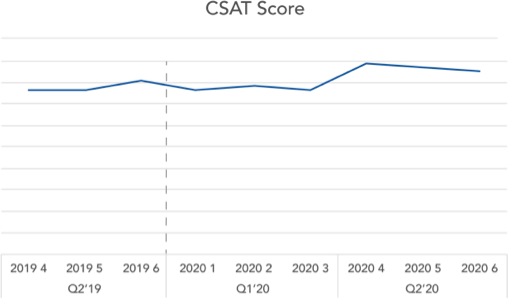
In Q2 2020, [24]7.ai retail clients faced an astonishing increase in consumer web traffic, chats, and messaging. Assisted conversions, assisted revenue, and average order value rose right along with the increased online demand. Yet customer satisfaction (CSAT) scores went up too.
That’s worth repeating: Suddenly forced to transition much of their call center staff to at-home work while rapidly scaling up their digital service capacity to meet a deluge of online customers, [24]7.ai retail clients actually made their customers more satisfied.
For more details, take a look at the “Q2 2020 Retail Industry Statistics” section, below.
We continually compile and analyze brand and consumer activity and sentiment. The stats below compare Q2 2020 metrics to Q2 2019 and Q1 2020 metrics in the following categories:
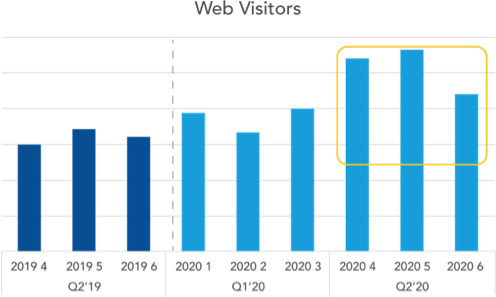
Retail customers turned to the web in droves in Q2, boosting brand traffic by more than 60 percent over Q2 2019 levels (year over year, or YoY) and 38 percent over the previous quarter (quarter over quarter, or QoQ).
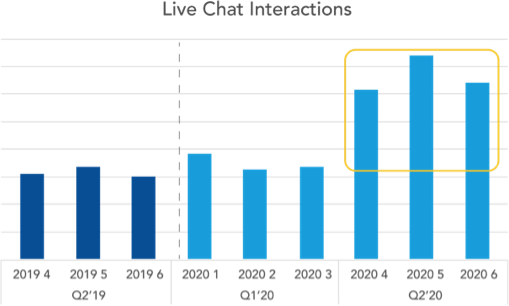
Live chat volumes in Q2 grew 220 percent YoY and nearly 90 percent QoQ. That is just an avalanche of chatting.
The booming web traffic alone, however, doesn’t account for all the increased chat. In fact, the Q2 Chats to Visitors ratio was up nearly a third YoY and more than a third QoQ. So, yes, more consumers engaged with their brands online—and they chose live chat at a much greater rate than previously.
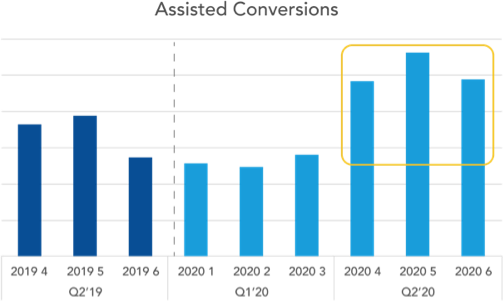
Not surprisingly, assisted conversions were way up too: 50 percent higher YoY and nearly double compared to last quarter.
Conversion rates, on the other hand, were down 29 percent QoQ. That’s because much of the chat increase involved non-sales interactions (such as queries about late shipments, returns/refunds, and the like).
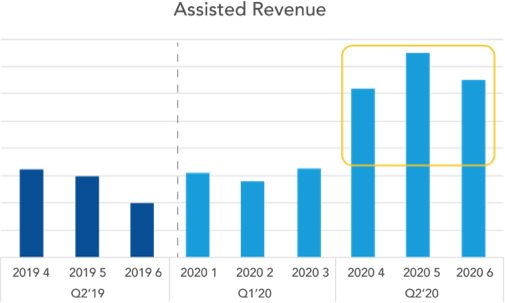
Also not surprisingly, as purchasing activity migrated from stores to online, assisted revenues were way up—nearly 150 percent growth YoY and nearly 125 percent QoQ. The average order value also grew YoY and QoQ.
CSAT scores were up by 13 percent, both YoY and QoQ. That means as more customers turned to online support and service, as a group they became more satisfied.

There’s a growing thought that AI is taking over the world. That is far from…

Chatbots are increasingly becoming a prominent feature in the customer service…