


Director, Strategic Insights
As the charts below make clear, retail’s strong move to online sales at the start of 2020—see our blog, “Retail Traffic Migrates from In-Store to Online,” for details—has continued to strengthen.
In Q4 2020, nearly a year into the pandemic, [24]7.ai™ retail clients continued to confront a steady increase in consumer web traffic, chats, and messaging. Assisted conversions, assisted revenue, and average order value rose right along with the increased online demand. Yet customer satisfaction (CSAT) scores were not negatively impacted.
For more details, take a look at the “Q4 2020 Retail Industry Statistics” section, below.
We continually compile and analyze brand and consumer activity and sentiment. The stats below compare Q4 2020 metrics to Q3 2020 and Q4 2019 metrics in the following categories:
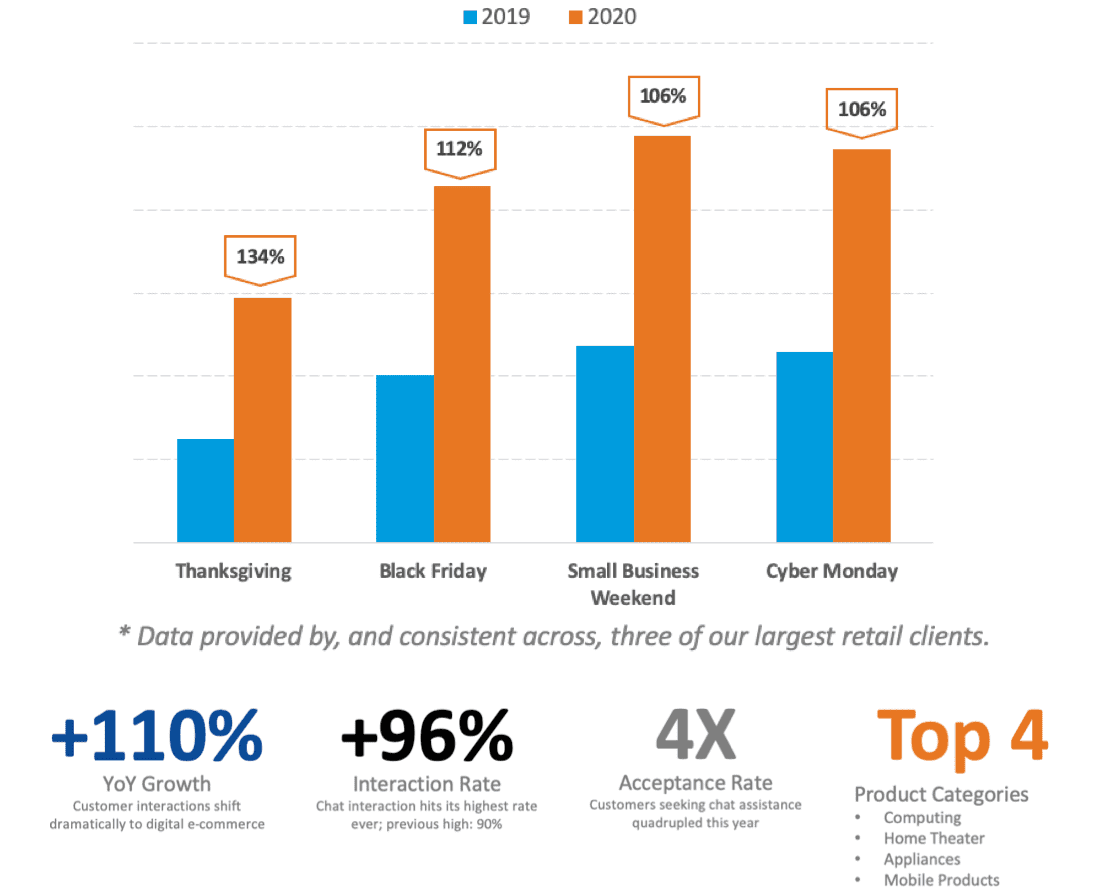
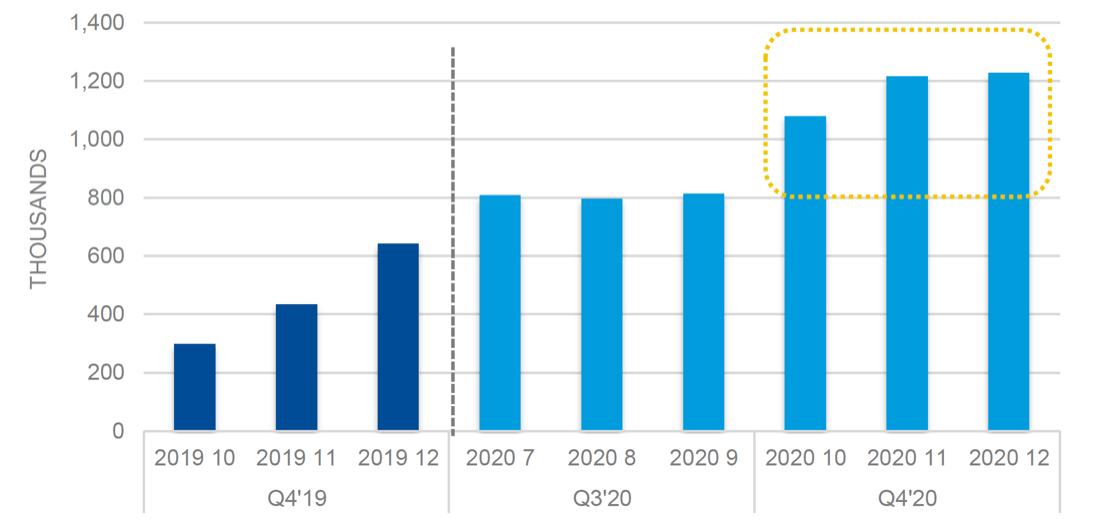
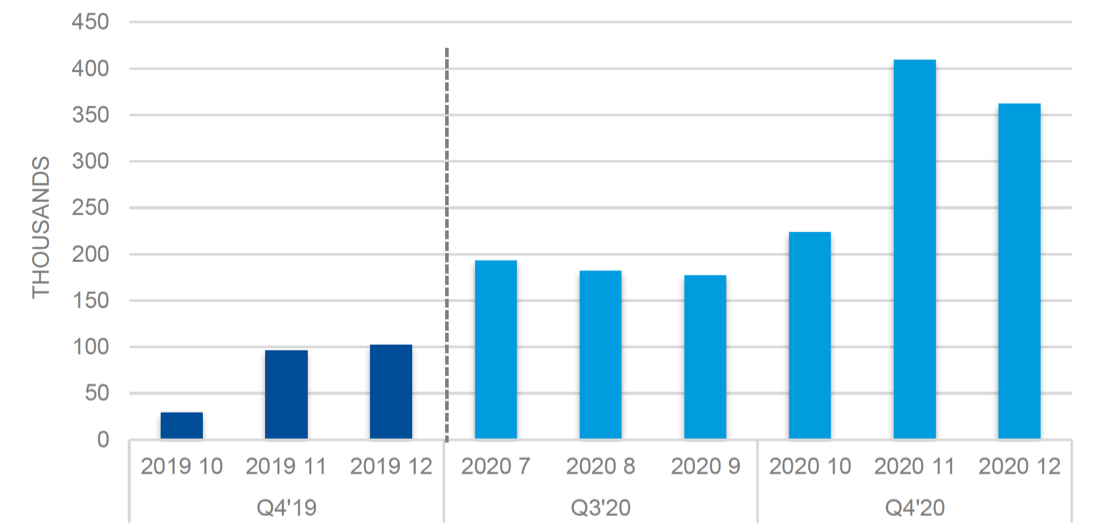
Retail customers turned to the web in droves in the 2020 holiday season, boosting web traffic 25 percent compared to Q4 2019 (year over year, or YoY) and 48 percent compared to Q3 2020 (quarter over quarter, or QoQ).
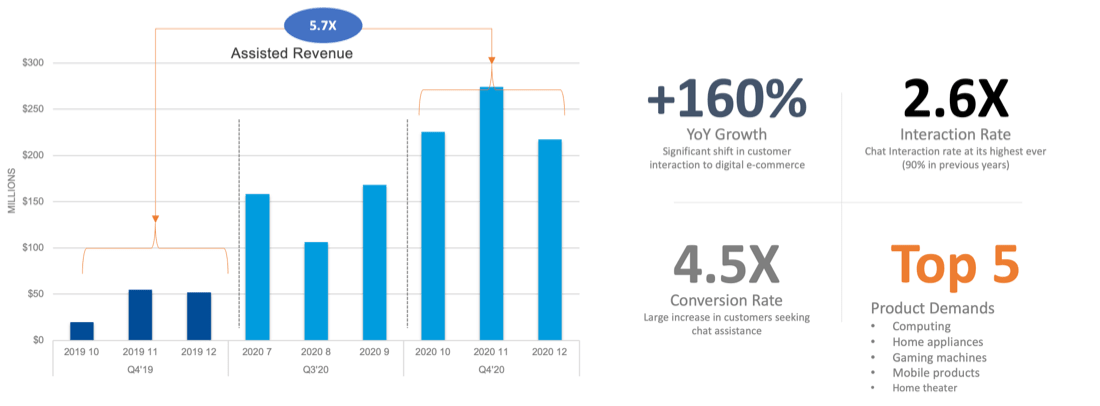
Increased web penetration contributed to 2.6X higher chat interaction YoY and 46 percent growth QoQ. As a result, the Chats to Visitors ratio grew 2X YoY, making it a good year for digital transformation, and showcasing the ability of our agents to handle high digital demand.
Absolute conversion numbers were up 1.8X QoQ and 4.5X compared to Q4 2019 (YoY). The YoY conversion rate also increased significantly, up 70 percent, due to a surge in online sales and contactless curbside pickup.
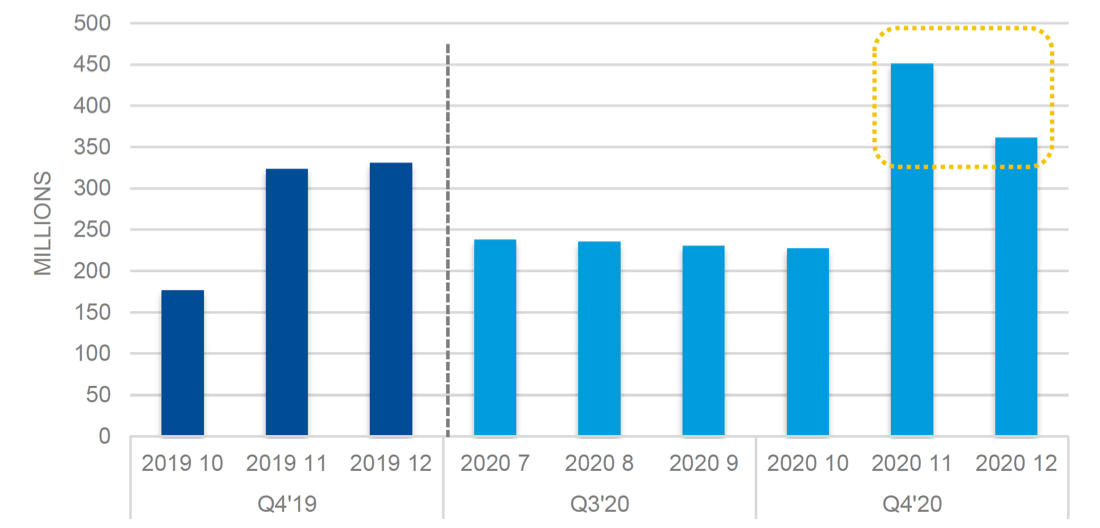
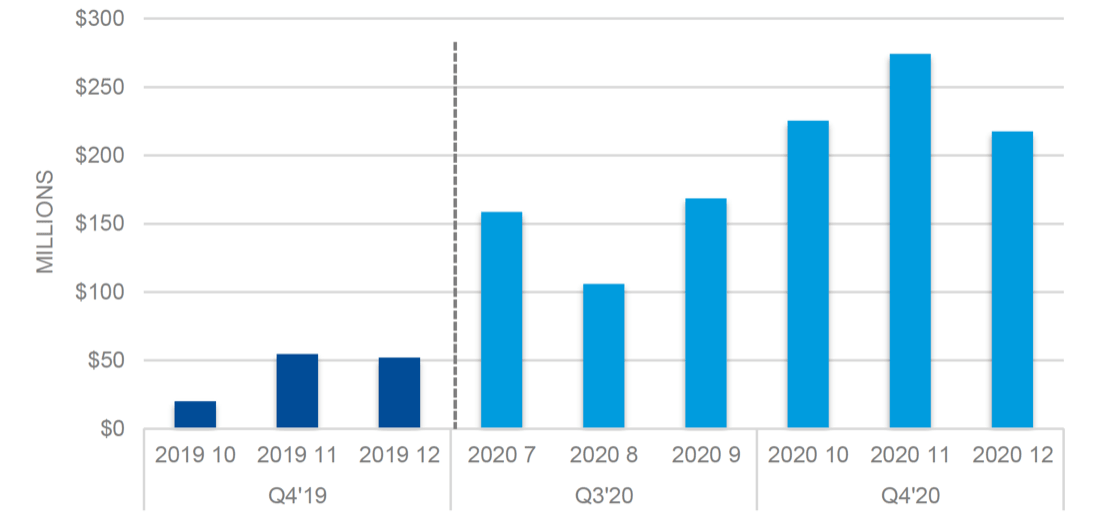
Assisted revenue grew 5.7X YoY and 66 percent QoQ, indicating retailers were able to effectively capitalize on first-time online buyers. Average order value also rose 29 percent YoY, due to a disproportionate increase in electronics and home appliance sales this holiday season.
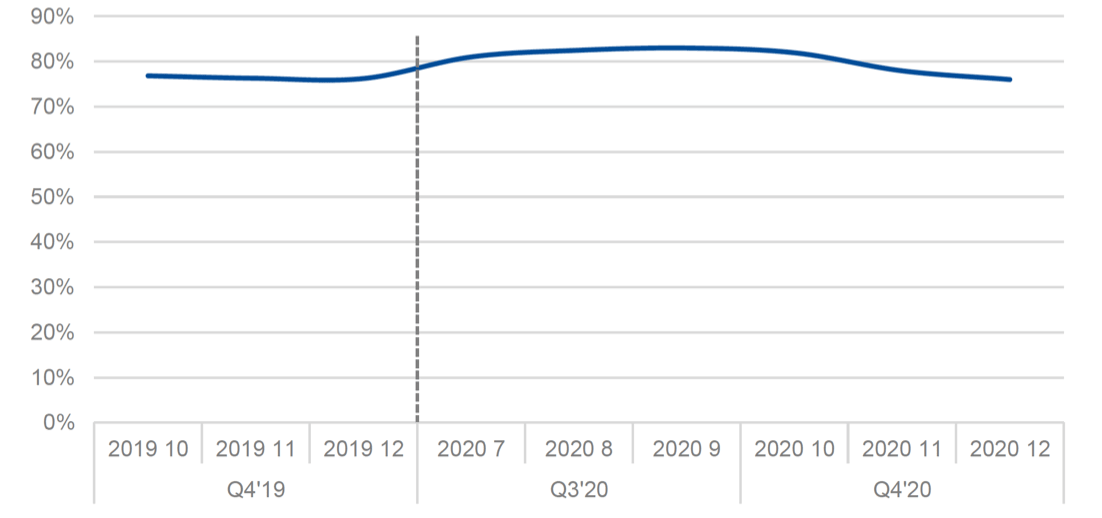
CSAT stayed flat, which, given the volume of customer contacts, is impressive.
Want to transform your customers’ shopping experience while boosting revenue and building loyalty? Check out our Transform Retail CX with AI infographic and visit our Retail Industry web page.
For more information, email us or visit our Contact Us page.

Crafting a standout customer journey

Strategies to ensure your contact center isn't just good but extraordinary