


Director, Strategic Insights
To gauge the impact of our products, we regularly review their activity and performance trends.
[24]7 Answers™ is our tool for creating interactive customer experiences out of FAQs, policies, product information, and more. However, please note: These charts reflect the product’s search-engine capabilities only.
Below we showcase Q1 2021 trends in the following categories:
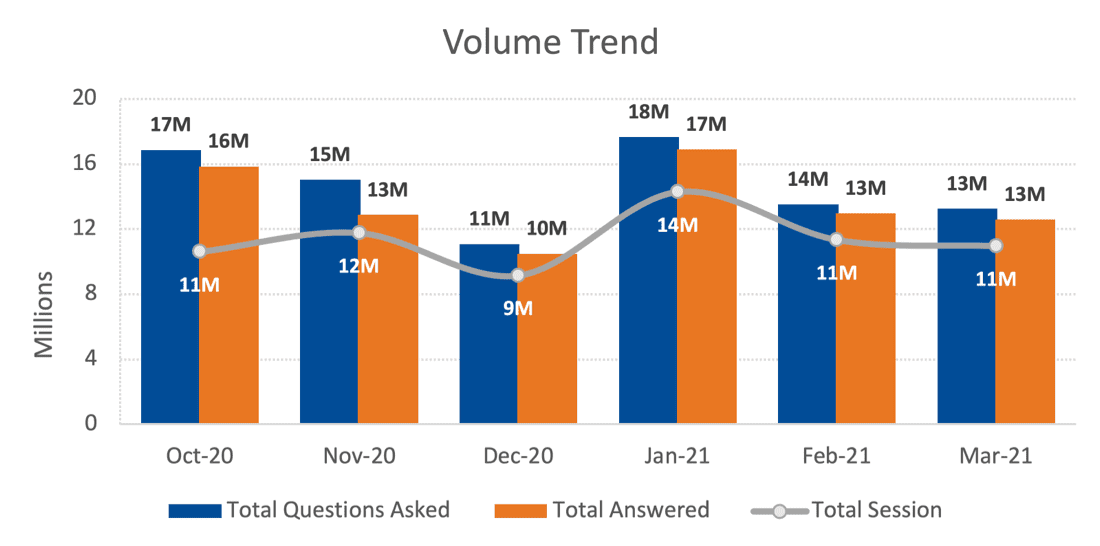
[24]7 Answers search traffic was up 11 percent QoQ; the Banking, Financial Services, and Insurance (BFSI) vertical contributed the bulk of that increase, aided by Education. Average unique sessions came in at over 11 million per month.
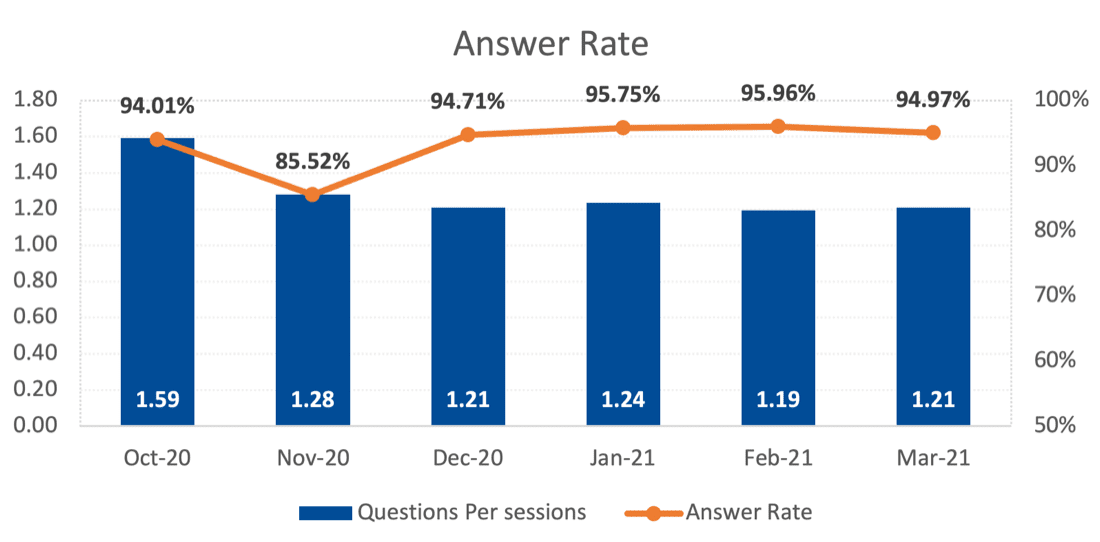
The Answer Rate bounced back to 95 percent after a weak Energy sector performance pulled it down in November 2020. The highest and lowest performing areas were Education (about 99 percent) and the American airlines (about 86 percent) industries, respectively.
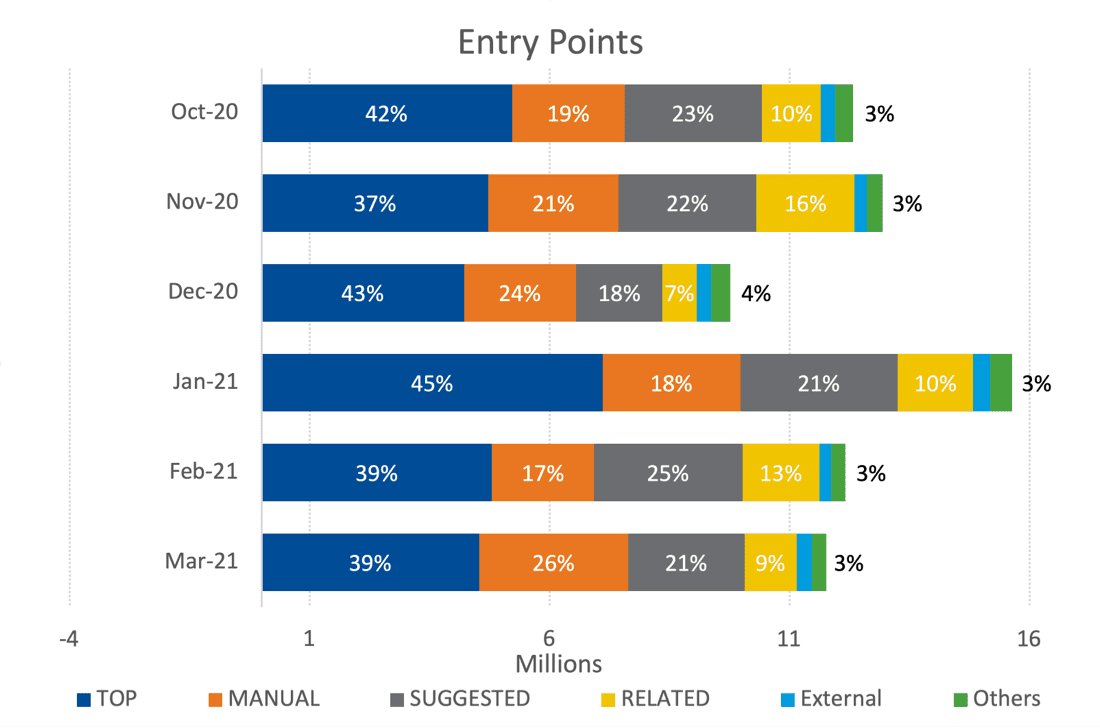
The most common way consumers initiate a [24]7 Answers search? Selecting the “Top FAQs” list is the top choice for between 40-45 percent of users. The share of Manual Entry searches bumped up as more consumers looked for custom-tailored information.
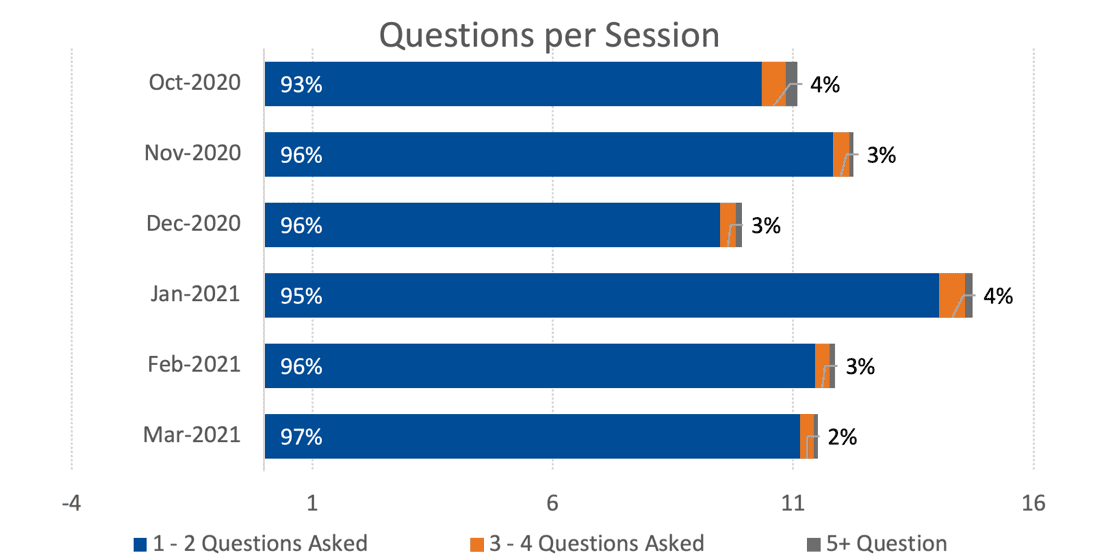
Ninety-five percent of search sessions end after customers ask just one or two questions. The upshot: Virtually every customer wants quick and concise assistance.
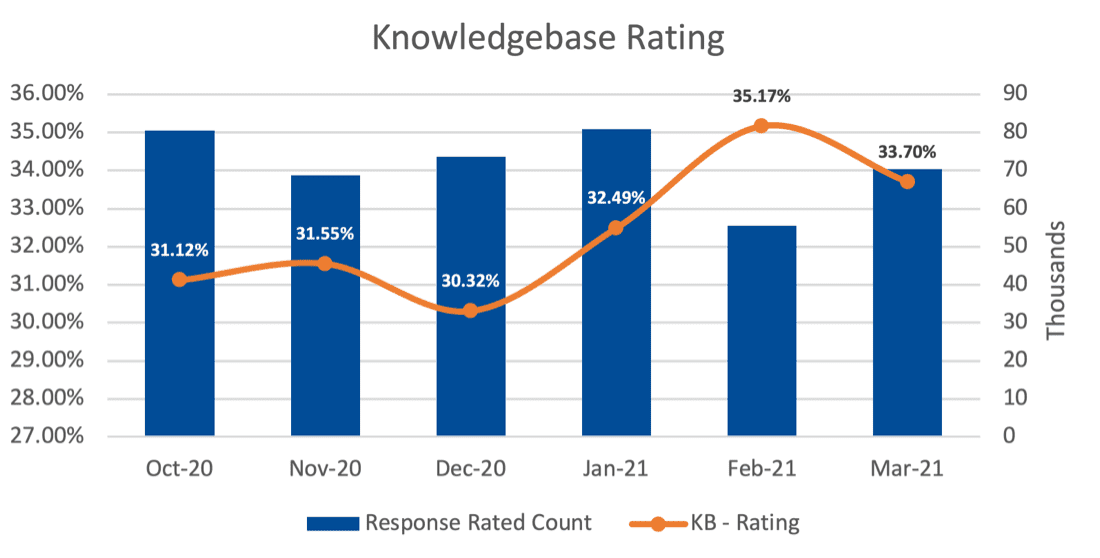
A large majority of customers were happy with the search-suggested knowledgebase articles. In fact, their ratings were up 3 percent QoQ; most of this gain derived from Fin-Tech, where ratings improved 11 percent (59 to 70 percent).
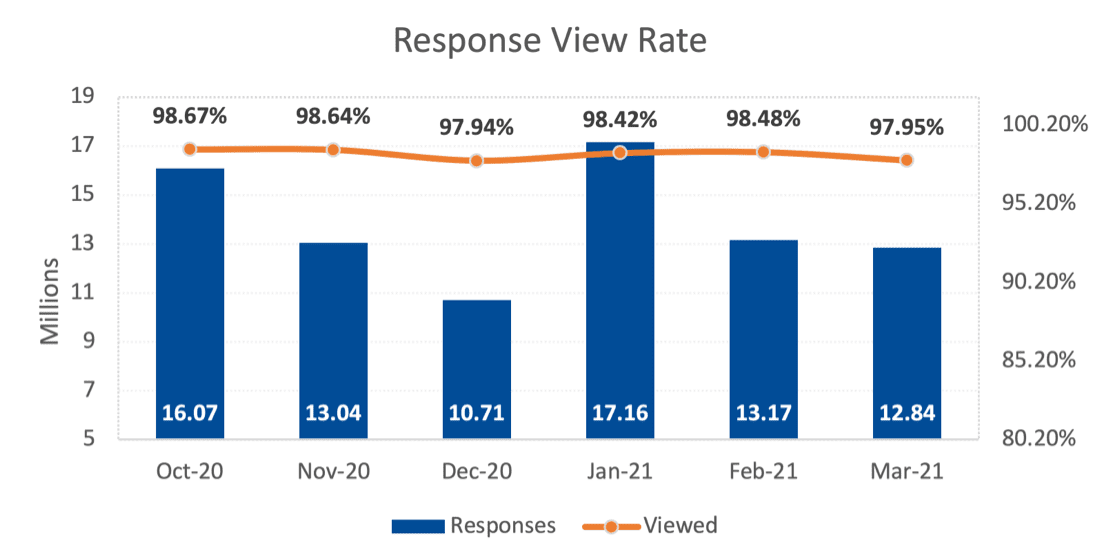
About 98 percent of customers view the virtual agent responses served up. This metric helps us gauge the relevancy to customers of virtual agent-recommended knowledgebase articles.
For more information: Email us, visit our Contact Us page, or browse the [24]7 Answers products page.

ChatGPT and the power of AI to power conversations

There’s a growing thought that AI is taking over the world. That is far from…